DK Goel Solutions Chapter 3 Tools for Financial Analysis
Read below DK Goel Solutions for Class 12 Chapter 3 Tools for Financial Analysis. These solutions have been designed based on the latest Class 12 DK Goel Accountancy book used by commerce stream students issued for the current year and the questions given in each chapter.
Post issue of financial statements we have to analyze the financial statements that they can be properly understood. there are various types of tools available for financial analysis. In this chapter, the students will understand these tools and how to use them for the analysis of financial statements. this is a very important chapter as this will help them in future when they are self analysing the statements or even if they are appearing in various kind of competitive exams.
The chapter contains a lot of questions which can be very helpful for Class 12 commerce students of Accountancy and will also help build strong concepts which will be really helpful in your career. These solutions are free and will help you to prepare for Class 12 Accountancy. Just scroll down and read through the answers provided below
Tools for Financial Analysis DK Goel Class 12 Accountancy Solutions
Short Answer Questions
Question 1.
Solution 1. If figures from financial accounts are put side-by-side for two or more years to allow comparison, they are considered ‘comparative financial statements.’ In such a statement, development numbers, sales from activities, costs, earnings, etc. are set side by side to draw conclusions regarding the company’s profitability and financial wellbeing. It also reveals the direction of transition as well as the enterprise’s high points and weak points.
Question 2.
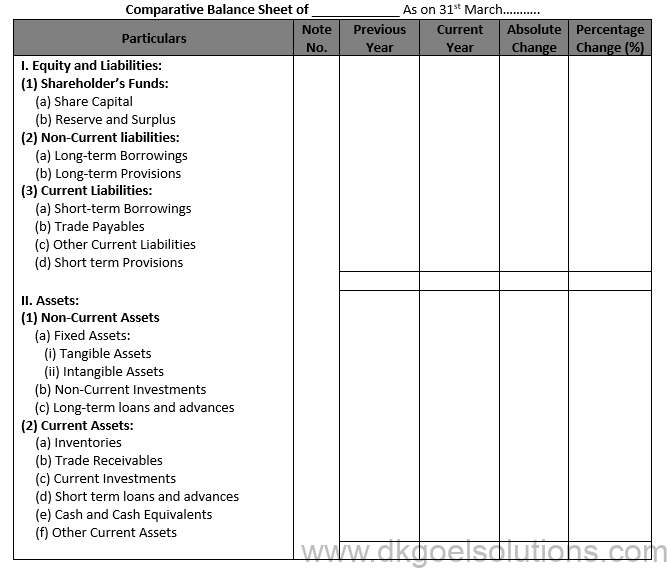
Solution 2. The balance sheet in a particular year displays only the balance of accounts at a given date, while the comparative balance sheet shows not only the balance of accounts at various times, but also the degree of rise or decline of different balance sheet items.
There are five columns in the form of a comparable balance sheet. The Balance Sheet elements are listed in the first column. The date for the previous year is highlighted in the second column, and the date for the present year is shown in the third column. In terms of rupee numbers, the increases or decreases in absolute data are seen in the fourth section. The fifth column displays the percentage in absolute data of rise or decline.
Question 3.
Solution 3. The Benefit and Loss Statement indicates the net profit or net loss for the year. The net results over a period of years are indicated by a comparative statement of benefit and loss, such that shifts in absolute data in terms of money as well as figures can be understood. The comparative benefit and loss statement contains the following information:
i. Increase or decrease in revenue from operations.
ii. Increase or decrease in cost of materials consumed.
iii. Increase or decrease in incomes and expenses.
iv. Increase of decrease in net profit.
The type of comparative benefit and loss statement also consists of five columns. Things from the Benefit & Loss statement are shown in the first column. The data for the previous year is displayed in the second column, and the date for the present year is shown in the third column. In terms of rupee numbers, the rise or decrease in absolute data is seen in the fourth column.
Question 4.
Solution 4.
Question 5.
Solution 5

Question 6.
Solution 6

Numerical Questions
Question 1.
Solution 1:

Working Notes:-
Computation of Percentage Change:-
1.) Changes in Share Capital = Current Share Capital – Previous Share Capital
Changes in Share Capital = Rs. 8,00,000 – Rs .5,00,000
Changes in Share Capital = Rs. 3,00,000
Share Capital = (Changes in Share Capital)/(Base year Capital) × 100
Share Capital = 3,00,000/5,00,000 × 100 = 60%
2.) Changes in Long-term Borrowings = Current Long-term Borrowings – Previous Long-term Borrowings
Changes in Long-term Borrowings = Rs. 8,00,000 – Rs .5,00,000
Changes in Long-term Borrowings = Rs. 3,00,000
Long-term Borrowings = (Changes in Long-term Borrowing)/(Base year Long-term Borrowing) × 100
Long-term Borrowings = 1,00,000/3,00,000 × 100 = 33.33%
Question 2.
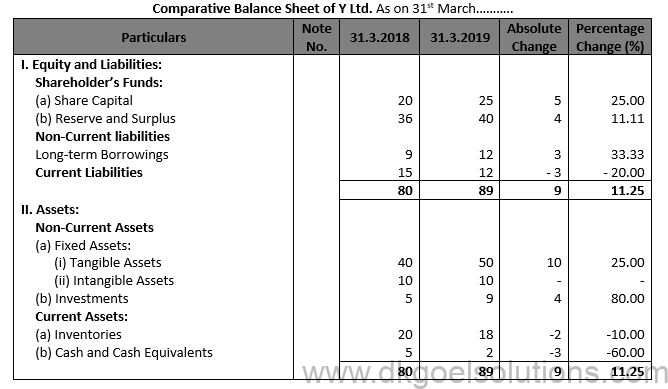
Solution 2
Working Notes:-
Computation of Percentage Change:-
1.) Changes in Share Capital = Current Share Capital – Previous Share Capital
Changes in Share Capital = 25 – 20
Changes in Share Capital = 5
Share Capital = (Changes in Share Capital)/(Base year Capital) × 100
Share Capital = 5/20×100 = 25%
2.) Changes in Reserve and Surplus = Current Reserve and Surplus – Previous Reserve and Surplus
Changes in Reserve and Surplus = 40 – 36
Changes in Reserve and Surplus = 4
Reserve and Surplus = (Changes in Reserve and Surplus)/(Base year Reserve and Surplus) × 100
Reserve and Surplus = 4/36 ×100 = 11.11%
3.) Changes in Long-term Borrowings = Current Long-term Borrowings – Previous Long-term Borrowings
Changes in Long-term Borrowings = 12 – 9
Changes in Long-term Borrowings = 3
Long-term Borrowings = (Changes in Long-term Borrowing)/(Base year Long-term Borrowing) × 100
Long-term Borrowings = 3/9×100 = 33.33%
Question 3.
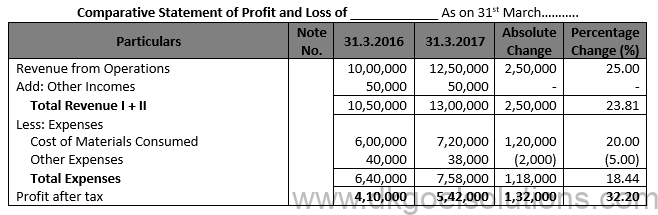
Solution 3

Working Notes:-
Computation of Percentage Change:-
1.) Changes in Share Capital = Current Share Capital – Previous Share Capital
Changes in Share Capital = 375 – 400
Changes in Share Capital = -25
Share Capital = (Changes in Share Capital)/(Base year Capital) × 100
Share Capital = (-25)/400×100 = -6.25%
2.) Changes in Reserve and Surplus = Current Reserve and Surplus – Previous Reserve and Surplus
Changes in Reserve and Surplus = 72 – 60
Changes in Reserve and Surplus = 12
Reserve and Surplus = (Changes in Reserve and Surplus)/(Base year Reserve and Surplus) × 100
Reserve and Surplus = 12/60 ×100 = 20%
3.) Changes in Long-term Borrowings = Current Long-term Borrowings – Previous Long-term Borrowings
Changes in Long-term Borrowings = 150 – 90
Changes in Long-term Borrowings = 60
Long-term Borrowings = (Changes in Long-term Borrowing)/(Base year Long-term Borrowing) × 100
Long-term Borrowings = 60/90×100 = 66.67%
Question 4.
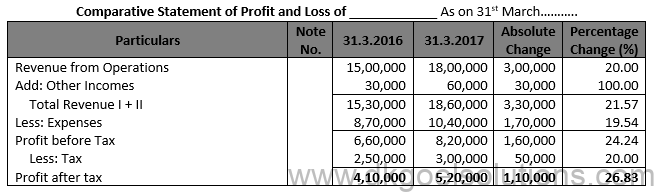
Solution 4
Working Notes:-
Computation of Percentage Change:-
1.) Changes in Revenue from Operations = Current Revenue from Operations – Previous Revenue from Operations
Changes in Revenue from Operations = Rs. 15,00,000 – Rs. 18,00,000
Changes in Revenue from Operations = Rs. 3,00,000
Revenue from Operations = (Changes in Revenue from Operations)/(Base Revenue from Operations)×100
Revenue from Operations = 3,00,000/15,00,000 ×100 = 20%
2.) Changes in Total Revenue = Current Total Revenue – Previous Total Revenue
Changes in Total Revenue = Rs. 18,60,000 – Rs. 15,30,000
Changes in Total Revenue = Rs. 3,30,000
Total Revenue = (Changes in Total Revenue)/(Base year Total Revenue)×100
Total Revenue = 3,30,000/15,30,000 ×100 = 21.57%
Question 5.
Solution 5
Point for Students:-
In order to estimate the future progress of a firm, it is necessary to look into its past performance. For this purpose, it becomes essential to make comparative study of its financial statements for two or more years.
When financial statements figures for two or more years are placed side-by-side to facilitate comparison, these are called ‘Comparative Financial Statements’.
Question 6.

Point for Students:-
The comparative benefit and loss statement contains the following information:
i. Increase or decrease in revenue from operations.
ii. Increase or decrease in cost of materials consumed.
iii. Increase or decrease in incomes and expenses.
iv. Increase of decrease in net profit.
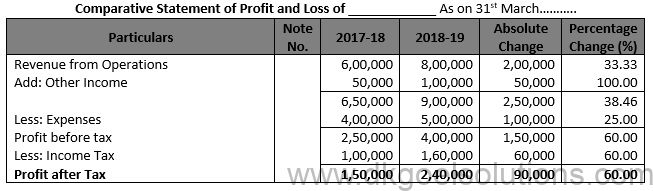
Question 7.
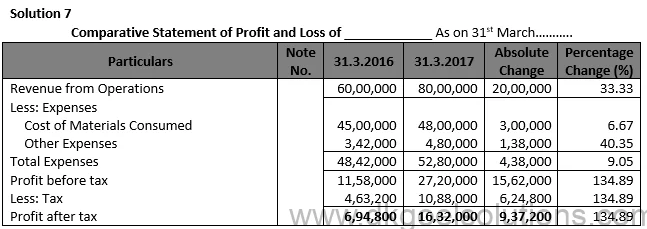
Working Notes:-
Computation of Percentage Change:-
1.) Changes in Revenue from Operations = Current Revenue from Operations – Previous Revenue from Operations
Changes in Revenue from Operations = Rs. 80,00,000 – Rs. 60,00,000
Changes in Revenue from Operations = Rs. 20,00,000
Revenue from Operations = (Changes in Revenue from Operations)/(Base Revenue from Operations)×100
Revenue from Operations = 20,00,000/60,00,000 ×100 = 33.33%
2.) Changes in Total Revenue = Current Total Revenue – Previous Total Revenue
Changes in Total Revenue = Rs. 52,80,000 – Rs. 48,42,000
Changes in Total Revenue = Rs. 4,38,000
Total Revenue = (Changes in Total Revenue)/(Base year Total Revenue)×100
Total Revenue = 4,38,000/52,80,000 ×100 = 9.05%
Question 8.
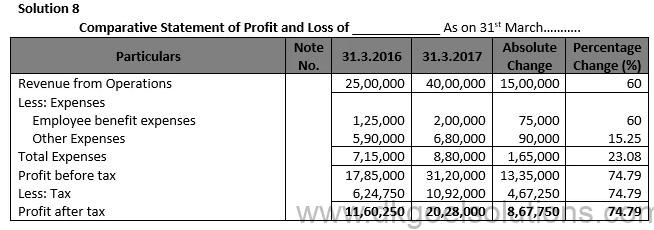
Points for Students:-
The form of comparative statement of profit and loss also consists of five columns. In the first column items of Statement of Profit and loss are shown. In the second column the data for previous year is shown and in the third column the data for current year is shown. In the fourth column the increase or decrease in absolute data is shown in term of rupee amounts. Fifth column shows the increase or decrease in various items in the form of percentages.
Question 9.

Points for Students:-
The form of comparative statement of profit and loss also consists of five columns. In the first column items of Statement of Profit and loss are shown. In the second column the data for previous year is shown and in the third column the data for current year is shown. In the fourth column the increase or decrease in absolute data is shown in term of rupee amounts. Fifth column shows the increase or decrease in various items in the form of percentages.
Question 10.
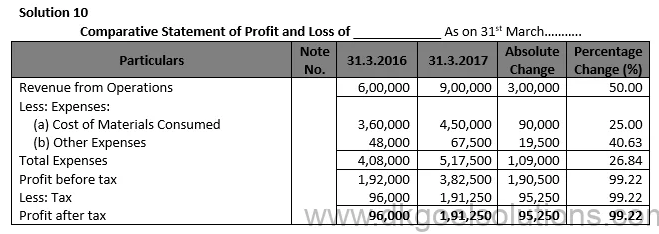
Point for Students:-
The comparative benefit and loss statement contains the following information:
i. Increase or decrease in revenue from operations.
ii. Increase or decrease in cost of materials consumed.
iii. Increase or decrease in incomes and expenses.
iv. Increase of decrease in net profit.
Question 11.

Working Note:-
Computation of Gross Profit:-
Gross Profit = Revenue from Operations – Cost of Materials Consumed
Gross Profit for the Year of 2014-15 = Rs. 6,00,000 – Rs. 4,50,000
Gross Profit for the Year of 2014-15 = Rs. 1,50,000
Gross Profit for the Year of 2015-16 = Rs. 8,00,000 – Rs. 4,80,000
Gross Profit for the Year of 2015-16 = Rs. 3,20,000
Computation of Other Expenses:-
Other Expenses for the year of 2014-15 = Rs. 1,50,000 × 10%
Other Expenses for the year of 2014-15 = Rs. 15,000
Other Expenses for the year of 2015-16 = Rs. 3,20,000 × 20%
Other Expenses for the year of 2014-15 = Rs. 64,000
Question 12.

Point for Students:-
In order to estimate the future progress of a firm, it is necessary to look into its past performance. For this purpose, it becomes essential to make comparative study of its financial statements for two or more years.
When financial statements figures for two or more years are placed side-by-side to facilitate comparison, these are called ‘Comparative Financial Statements’.
Question 13.
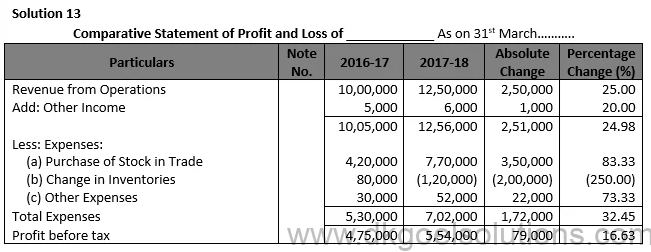
Points for Students:-
The form of comparative statement of profit and loss also consists of five columns. In the first column items of Statement of Profit and loss are shown. In the second column the data for previous year is shown and in the third column the data for current year is shown. In the fourth column the increase or decrease in absolute data is shown in term of rupee amounts. Fifth column show the increase or decrease in various items in the form of percentages.
Question 14.

Point for Students:-
The comparative benefit and loss statement contains the following information:
i. Increase or decrease in revenue from operations.
ii. Increase or decrease in cost of materials consumed.
iii. Increase or decrease in incomes and expenses.
iv. Increase of decrease in net profit.
Question 15.

Point for Students:-
Comparative Statement of profit and loss provides the following information:-
(i) Rate of increase or decrease in revenue from operations.
(ii) Rate of increase or decrease in cost of materials consumed.
(iii) Rate of increase or decrease in incomes and expenses.
(iv) Rate of increase or decrease in net profit.
Question 16.
Solution 16
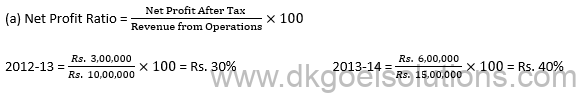
(b) Values which Yash Ltd. is trying to propagate:-
(i) Workers’ hard work and integrity are recognised.
(ii) The company’s ethical policies.
Point for Students:-
The comparative benefit and loss statement contains the following information:
i. Increase or decrease in revenue from operations.
ii. Increase or decrease in cost of materials consumed.
iii. Increase or decrease in incomes and expenses.
iv. Increase of decrease in net profit.
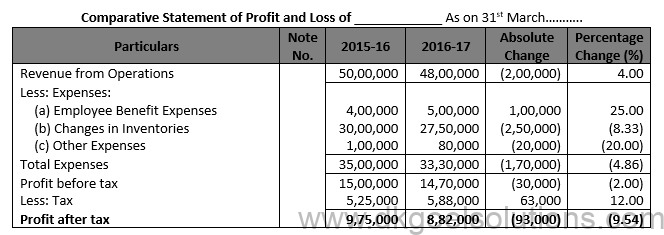
Question 17.
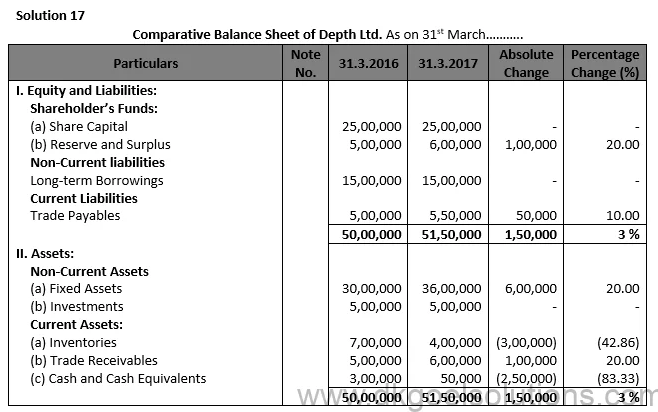
Working Notes:-
The percentage increase or decrease is calculated as follows:-
1.) 1,00,000/5,00,000 × 100 = 20.00%
2.) 6,00,000/30,00,000 × 100 = 20.00%
Point for Students:-
In order to estimate the future progress of a firm, it is necessary to look into its past performance. For this purpose, it becomes essential to make comparative study of its financial statements for two or more years.
When financial statements figures for two or more years are placed side-by-side to facilitate comparison, these are called ‘Comparative Financial Statements’.
Question 18.

Point for Students:-
The comparative benefit and loss statement contains the following information:
i. Increase or decrease in revenue from operations.
ii. Increase or decrease in cost of materials consumed.
iii. Increase or decrease in incomes and expenses.
iv. Increase of decrease in net profit.
Question 19.

Point for Students:-
In order to estimate the future progress of a firm, it is necessary to look into its past performance. For this purpose, it becomes essential to make comparative study of its financial statements for two or more years.
When financial statements figures for two or more years are placed side-by-side to facilitate comparison, these are called ‘Comparative Financial Statements’.
Question 20.
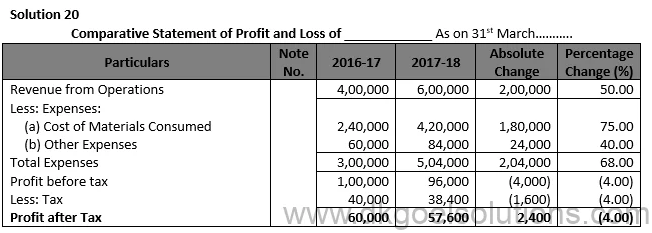
Point for Students:-
In order to estimate the future progress of a firm, it is necessary to look into its past performance. For this purpose, it becomes essential to make comparative study of its financial statements for two or more years.
When financial statements figures for two or more years are placed side-by-side to facilitate comparison, these are called ‘Comparative Financial Statements’.
Question 21.
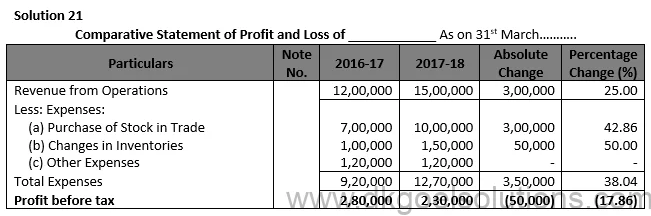
Point for Students:-
Comparative Statement of profit and loss provides the following information:-
(i) Rate of increase or decrease in revenue from operations.
(ii) Rate of increase or decrease in cost of materials consumed.
(iii) Rate of increase or decrease in incomes and expenses.
(iv) Rate of increase or decrease in net profit.
Question 22.

Point for Students:-
Comparative Statement of profit and loss provides the following information:-
(i) Rate of increase or decrease in revenue from operations.
(ii) Rate of increase or decrease in cost of materials consumed.
(iii) Rate of increase or decrease in incomes and expenses.
(iv) Rate of increase or decrease in net profit.
Question 23.

Point for Students:-
The comparative benefit and loss statement contains the following information:
i. Increase or decrease in revenue from operations.
ii. Increase or decrease in cost of materials consumed.
iii. Increase or decrease in incomes and expenses.
iv. Increase of decrease in net profit.
Question 24.

Point for Students:-
In order to estimate the future progress of a firm, it is necessary to look into its past performance. For this purpose, it becomes essential to make comparative study of its financial statements for two or more years.
When financial statements figures for two or more years are placed side-by-side to facilitate comparison, these are called ‘Comparative Financial Statements’.
Question 25.
Solution 25
Point for Students:-
Comparative Statement of profit and loss provides the following information:-
(i) Rate of increase or decrease in revenue from operations.
(ii) Rate of increase or decrease in cost of materials consumed.
(iii) Rate of increase or decrease in incomes and expenses.
(iv) Rate of increase or decrease in net profit.
Question 26.
Solution 26

Point for Students:-
In order to estimate the future progress of a firm, it is necessary to look into its past performance. For this purpose, it becomes essential to make comparative study of its financial statements for two or more years.
When financial statements figures for two or more years are placed side-by-side to facilitate comparison, these are called ‘Comparative Financial Statements’.
Question 27.
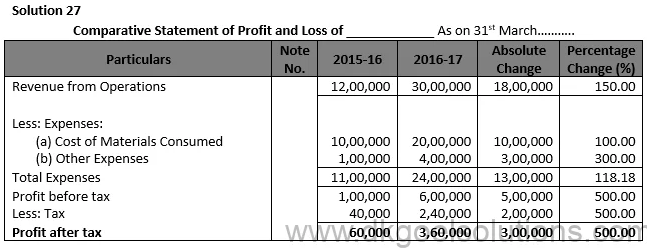
Point for Students:-
The comparative benefit and loss statement contains the following information:
i. Increase or decrease in revenue from operations.
ii. Increase or decrease in cost of materials consumed.
iii. Increase or decrease in incomes and expenses.
iv. Increase of decrease in net profit.
Question 28.

Point for Students:-
Comparative Statement of profit and loss provides the following information:-
(i) Rate of increase or decrease in revenue from operations.
(ii) Rate of increase or decrease in cost of materials consumed.
(iii) Rate of increase or decrease in incomes and expenses.
(iv) Rate of increase or decrease in net profit.
Question 29.

Point for Students:-
In order to estimate the future progress of a firm, it is necessary to look into its past performance. For this purpose, it becomes essential to make comparative study of its financial statements for two or more years.
When financial statements figures for two or more years are placed side-by-side to facilitate comparison, these are called ‘Comparative Financial Statements’.
Question 30.

Point for Students:-
The comparative benefit and loss statement contains the following information:
i. Increase or decrease in revenue from operations.
ii. Increase or decrease in cost of materials consumed.
iii. Increase or decrease in incomes and expenses.
iv. Increase of decrease in net profit.
Question 31.
Solution 31
Point for Students:-
In order to estimate the future progress of a firm, it is necessary to look into its past performance. For this purpose, it becomes essential to make comparative study of its financial statements for two or more years.
When financial statements figures for two or more years are placed side-by-side to facilitate comparison, these are called ‘Comparative Financial Statements’.
A comparative balance sheet is an official document that highlights a company’s financial position over a range of periods. A comparative balance sheet portrays the balance of the accounts as well as presents a variation picture of different items of the balance sheet.
Every company needs a comparative balance sheet to get the exact information about the financial position. The comparative balance sheet primarily comprises five columns. The first column represents the items on the balance sheet. The second and third column highlights the dates of the previous year and the date of the current year respectively. The fourth column depicts the increase or decrease in the company’s financial status in terms of rupees, and the final column highlights the percentage increase or decrease in the absolute data of the company.
The analysis of a financial statement is a complex process that requires many tools to drive out the exact figures, defining the company’s financial status. Here are the commonly used tools for analysis of the financial statements of the companies-
● Common Size Statement
● Comparative Statement
● Ratio Analysis
● Cash Flow Statement
A comparative statement of profit and loss represents the net profit or loss of a specific number of accounting years for a company. A well-designed comparative statement presents the companies the absolute data in terms of amount and the percentage. It helps the companies to trace the trend of performance and profitability of the business.
Common size statements can be defined as the statements which represent the amounts of several items included in the financial statements in terms of percentages to a common base.
The two primary types of common size statements are –
● Common Size Balance Sheet
● Common Size Statement of Profit and Loss
Also refer to TS Grewal Solutions for Class 12