Notes for Class 12 Accountancy Chapter 4 Analysis of Financial Statement
Commerce students can refer to the Analysis of Financial Statement Notes Class 12 Accountancy given below which is an important chapter in class 12 accountancy book. These notes and important questions and answers have been prepared based on the latest CBSE and NCERT syllabus and books issued for the current academic year. Our team of Accountancy teachers have prepared these notes for the benefit of students so that you can read these revision notes and understand each topic carefully.
Analysis of Financial Statement Notes Class 12 Accountancy
Refer to the notes and important questions given below for Analysis of Financial Statement which are really useful and have been recommended by Class 12 Accounts teachers. Understanding the concepts in detail and then solving questions by yourself will help you to learn all topics given in your NCERT Books for Class 12 Accounts.
Questions. Comparative Financial statements means.
(a) To facilitate comparison for two or more Years
(b) To show Financial Position
(c) To compute profit or loss of two or more years
(d) None of the above
Answer:
(a) To facilitate comparison for two or more Years
Questions. Reserve and surplus of current year is ₹24,00,000 and ₹12,00,000 for previous year. What will be the Absolute change?
Solution: Absolute change = 24,00,000-12,00,000=12,00,000
Questions. Reserve and surplus of current year is ₹24,00,000 and ₹12,00,000 for previous year. What will be the percentage change?
Solution: (24,00,000−12,00,000)×100 / 12,00,000=100%
Questions. In a company other income is ₹ 2,00,000 and Revenue from operation is ₹8,00,000. What will be the percentage to revenue from operation?
Ans.200000 / 800000 ×100=25%
Questions. Which of the following cannot be identified with the help of comparative Balance Sheet?
(a) Rate of Increase or decrease in share Capital
(b) Rate of increase or decrease in reserve and surplus
(c) Rate of increase or decrease in revenue from operation
(d) Rate of increase or decrease in Trade receivables
Answer:
(c) Rate of increase or decrease in revenue from operation
Questions.Which of the following cannot be identified with the help of comparative Statement of profit and loss?
(a) Rate of increase or decrease in expenses
(b) Rate of increase or decrease in revenue from operation
(c) Rate of increase or decrease in net profit
(d) Rate of increase or decrease in Trade payables
Answer:
(d) Rate of increase or decrease in Trade payables
Questions. In Common size Balance sheet, which figure is assumed to be equal to 100?
(a) Revenue from operation
(b) Net profit
(c) Total expenses
(d) Equities and liabilities
Answer:
(d) Equities and liabilities
Questions. In Common size Balance sheet, which of following figure is assumed to be equal to 100?
(a) Equities and liabilities
(b) Total Assets
(c) Either (a) or (b)
(d) None of the above
Answer:
Either (a) or (b)
Questions. In common size statement of Profit and Loss which figure is assumed to be equal to 100?
(a) Total Assets
(b) Equities and Liabilities
(c) Revenue from Operation
(d) None of the above
Answer:
(c) Revenue from Operation
Questions. Prepare comparative Balance sheet of Gama Ltd. following Balance sheet from the balance sheet as at 31st March 2018 and 2017:


Questions. Prepare Comparative Statement of Profit and Loss from the Given Statement of Profit and Loss

Solution:

Questions. From the following Information Prepare comparative Statement of profit and Loss

Solution:

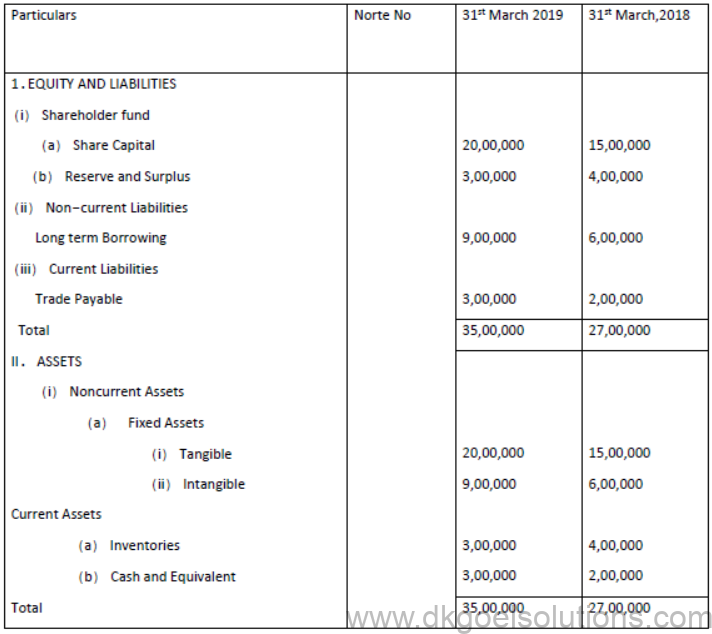
Questions. Prepare Common Size Balance Sheet from the given Balance Sheet


Solution:


Questions. Prepare Common Size Balance Sheet from the given Balance Sheet
Solution:

Questions. Prepare common size Balance sheet from the following information


Solution:

Questions. Prepare Common size Statement of profit and loss as of 31st March,2019 and 31st March,2020 from the given Statement of profit and loss


Solution:

Questions. Prepare Common Size statement of profit and loss from the following Information:


Solution:

Questions. Under which headings and subheadings will the following items be shown in the balance sheet of the company as per schedule III part I of the companies Act.2013:
(a) Cheque in hand
(b) Stock of work In progress
(c) Copy right
(d) Loose tools
(e) Provision for bad debts
(f) Negative balance shown by the profit and loss
(g) Bonds
(h) Unpaid Dividend
Solution:


Questions. From the following Information, Prepare comparative statement of Profit and loss:

Solution:


Notes for Analysis of Financial Statement class 12 Accountancy
Financial Statements analysis is a systematic process of studying the relationship among the various financial factors contained in the financial statements to have a better understanding of the working and the financial position of a business.
“Financial analysis consists inseparating facts according to some definite plan, arranging them in groups according to certain circumstances and then presenting them in a convenient and easily read and understandable form.”
–Finney and Miller
in simple words analysis of financial statements is a more comprehensive study of balance sheet and profit and loss account using the tools of analysis to get a proper understanding of profitability and financial position of business.
Objectives orPurposes of Financial Statement Analysis
To measure the Profitability or Earning Capacity of the business -analysis helps in measuring the profits and earning capacity of business. it helps in judging whether the profits are accurate or not.
To measure the FinancialStrength of the business – analysis helps in understanding the financial postion of the company. it helps in judging the financial health of the business.
To make ComparativeStudy within the firm (intra – firm) and with other firms (inter – firm)- analysis helps in comparisons of financial statements. There are two types of comparisons-
1) intra firm- it is the comparison within the business ie previous year and current year or from one department to another. it is also known as trend analysis.
2) inter firm- it is the comparison of one business to another ie comparing one company to
another. it is known as cross sectional analysis.
To judge the Efficiency of Management- profits and assets of the business helps in judging the efficiency of the business ie whether the business is utilising its resources in an efficient manner or not.
To provide Useful Information’s to the Management- analysis helps the management to get useful insight of the business which helps them in taking many managerical decisions.
To find out the Capability for payment of interest, dividend etc.- profitability of the business helps in judging whether the business will be able to pay interest and dividend. analysis helps in judging the capability of the business of paymnet of interest and dividend.
To measure the Short-term and Long-term Solvency of the business- analysis helps in judging whether the business will be able to pay its short term and long term dues.
Limitation of Financial Statement Analysis
Based on basic financial statement which themselves suffer from certain limitations- financial accounting has certain disadvantages itself which becomes the limitation of its analysis for example financial accounting records only historical cost which becomes the limitation of its analysis.
Ignores changes in price level.- financial accounting analysis does not take in to consideration the current changes in the prices in the economy.
Affected by the personal ability and bias of the analyst.- since analysis is done by the accountant he or she applies their on personal judgement while using the tools of analysis which affect the analysis.
Lack of qualitative analysis as only those transaction and events are recorded which can be measured in terms of money.- only those transactions in financial statements can be analysed which can be measured in money.
When different accounting policies are followed by the two firms then comparison between their financial statement becomes unreliable.- since accounting is dependent upon personal judgement of the accountant sometimes different policies adopted by accountant makes it difficult to compare the financial statements
Analysis of single year’s financial statement have limited use- single year financial statements are of limited use as they cannot be used for inter firm and intra firm comparisons.
Also affected by the Window dressing- if the values of different assets and liabilities are not shown at fair value the analysis will not give a fair picture of the business.
Types of Financial Statement Analysis
There are two main approaches for the analysis of financial statements.
Horizontal Analysis: In this type of analysis, figure in the financial statements for two or more years are compared and analyzed. It helps in knowing the trends of the business over a period of time. It is also known as Time series analysis or Dynamic Analysis. Comparative statements and cash flow statements are example of horizontal analysis.It is also known as intra firm analysis
Vertical Analysis: In this type of analysis, figures in the financial statement for a single year are analysed. It involves the study of relationship between various items of Balance Sheet or statement of Profit & Loss of a single year or period. It is also known as Static Analysis. Common size statements and ratio analysis relating to a particular accounting period are examples of this type of analysis.It is also called inter firm analysis.
Significance or Importance of Financial Analysis: the importance of the analysis is for two users-
i) internal users- these are the users within the business which require analysis of financial statements.the internal users are-
For Management: To know the profitability, liquidity and solvency position to measure the effectiveness of its own decisions taken and to take corrective measure in future.
For employees : employees need analysis to know about the profitability of the business as it is directly related to the salary and bonus they will get.
2) external users- these are the users outside the business which require analysis of financial statements. the external users are –
For Investors: Investors want to know the earning capacity and future growth prospects of the business which helps in assessing the safety of their investment and reasonable return.
For Creditors: Short-term creditors want to know the liquidity position of the business where as long term creditors want to know about the solvency position and ability to pay the interest consistently.
For Govt: To know the profitability position for taking taxation decision and to take decisions about the price regulations.
For Employees: To know the progress of the company for assessing bonus, possible increase in wages and to ensure stability of their jobs.
For Customers: To know about the continuance of the business in future.
Tools for financial statement analysis
The various tools used for analysis of financial statements are :
Comparative Statement : Financial Statements of two years are compared and changes in absolute terms and in percentage terms are calculated. It is a form of Horizontal Analysis.
Common Size statement : Figures of Financial statements are converted it to percentage with respect to some common base.
In Common size Income Statement Sales/Revenue from Operations is taken is common base where as in Common size Balance Sheet Total assets or Total Equity and Liabilities are taken as common base.
Ratio Analysis : It is a technique of Study of relationship between various items in the Financial Statements.There are mainly four types of ratios-
1) liquidity ratio
2) solvency ratio
3) activity ratio
4) profitability ratio
Cash Flow Statement : It is a statement that shows the inflow and outflow of cash and cash equivalents during a particular period which helps in finding out the causes of changes in cash position between the two balance sheet dates.It is prepared under accounting standard 3
ComparativeStatements
It is a statement that shows changes in each item of the financial statement in absolute amount and in percentage, taking the amounts of the preceding as counting period as the base.
Types of Comparative Statements :
1. Comparative Balance Sheet; and
2. Comparative Statement of Profit and Loss.
ComparativeBalance Sheet : It shows the increases and decreases in various items of assets, equity and liabilities in absolute term and in percentage term by taking the corresponding figures in the previous year’s balance sheet as a base.
Format for a Comparative Balance Sheet
Comparative Balance Sheet of ……… Ltd.
As at 31st March 2014 and 2015


*Percentage change = absolute change/ previous year *100
for example –

COMPARATIVE STATEMENT OF PROFIT AND LOSS/COMPARATIVE INCOME STATEMENTComparativeIncome Statement: It shows the increases and decreases in various items of income Statement in absolute amount and in percentage amount by taking the corresponding figures in the previous year’s Income Statement as a base.
Format for a Comparative Statement of Profit and Loss
ComparativeStatement of Profit and Loss
For the years ended on 31st March, 2014 and 2015

percentage = absolutechange/ previous year*100
Importance of Comparative Statement
To make the data simple and more understandable.
To indicate the trend with respect to the previous year.
To compare the firm performance with the performance of other firm in the same business.

CommonSize Statement
Common Size Financial Statements are the statements in which amounts of the various items of financial statements are converted into percentages to a common base.
Types of Common Size statements :
1. Common Size Balance sheet; and
2. Common Size Statement of Profit and Loss.
CommonSize Balance sheet : It is a statement in which every item of assets, equity and liabilities is expressed as a percentage to the total of all assets or to the total of Equity and Liabilities.
Format for a Common Size Balance Sheet :
Common Size Balance Sheet of…………….Ltd.
As at 31st March, 2014 and 2015


note – all the items are divided by the total of balance sheet to calculate the percentage.

Common Size Income Statement or Statement of Profit and Loss: It is a statement in which every item of Statement of Profit and Loss is expressed as a percentage to the amount of Revenue from Operations.
Format for a Common Size Statement of Profit and Loss:
Common Size Statement of Profit and Loss
For the years ended on 31st March, 2014 and 2015


note- all the items are divided by revenue from operations of that year to calculate the percentages.


Also download : Question Papers for Class 12 Accountancy
And
DK GOEL SOLUTIONS Chapter 1: Financial Statements of a Company (As Per Schedule III)
DK GOEL SOLUTIONS Chapter 2: Financial Statement Analysis