Notes for Class 12 Accountancy Chapter 5 Accounting Ratios
Commerce students can refer to the Accounting Ratios Notes Class 12 Accountancy given below which is an important chapter in class 12 accountancy book. These notes and important questions and answers have been prepared based on the latest CBSE and NCERT syllabus and books issued for the current academic year. Our team of Accountancy teachers have prepared these notes for the benefit of students so that you can read these revision notes and understand each topic carefully.
Accounting Ratios Notes Class 12 Accountancy
Refer to the notes and important questions given below for Accounting Ratios which are really useful and have been recommended by Class 12 Accounts teachers. Understanding the concepts in detail and then solving questions by yourself will help you to learn all topics given in your NCERT Books for Class 12 Accounts.
Q.1 The Two Basic Measures of Liquidity Ratio are-
(a) Stock and Debtors Turnover Ratio
(b) Current Ratio and operating ratio
(c) Current ratio and Liquid ratio
(d) Gross and Net profit Ratio
Answer :
Current ratio and Liquid ratio
Q.2 Ideal Current Ratio is
(a) 3:1
(b) 2:2
(c) 2:1
(d) 1:1
Answer :
2:1
Q.3 Ratio=
(a) 𝐶𝑢𝑟𝑟𝑒𝑛𝑡 𝐴𝑠𝑠𝑒𝑡𝑠 / 𝐶𝑢𝑟𝑟𝑒𝑛𝑡 𝐿𝑖𝑎𝑏𝑖𝑙𝑖𝑡𝑖𝑒𝑠
(b) 𝑄𝑢𝑖𝑐𝑘 𝐴𝑠𝑠𝑒𝑡𝑠 / 𝐴𝑠𝑠𝑒𝑡𝑠𝐶𝑢𝑟𝑟𝑒𝑛𝑡 𝑙𝑖𝑎𝑏𝑖𝑙𝑖𝑡𝑖𝑒𝑠
(c) 𝐹𝑖𝑥𝑒𝑑 𝐴𝑠𝑠𝑒𝑡𝑠 / 𝐶𝑢𝑟𝑟𝑒𝑛𝑡 𝑙𝑖𝑎𝑏𝑖𝑙𝑖𝑡𝑖𝑒𝑠
(d) None of the above
Answer :
𝐶𝑢𝑟𝑟𝑒𝑛𝑡 𝐴𝑠𝑠𝑒𝑡𝑠 / 𝐶𝑢𝑟𝑟𝑒𝑛𝑡 𝑙𝑖𝑎𝑏𝑖𝑙𝑖𝑡𝑖𝑒𝑠
Q.4 100- Operating Profit Ratio is equal to
(a) Operating Ratio
(b) Operating Net profit Ratio
(c) Gross Profit Ratio
(d) Current ratio
Answer :
Operating Ratio
Q.5 Liquid Assets=
(a) Current Assets-Inventory
(b) Current Assets + Inventory
(c) Current Assets- (Inventory + prepaid Expenses)
(d) None of the above
Answer :
Current Assets- (Inventory + prepaid Expenses)
Q.6 Which of following is not Activity Ratio?
(a) Inventory Turnover Ratio
(b) Trade receivable turnover Ratio
(c) Interest coverage Ratio
(d) All of these
Answer :
Interest coverage Ratio
Q.7 Debts to Equity ratio=
(a) 𝐷𝑒𝑏𝑡𝑠𝐸𝑞𝑢𝑖𝑡𝑦
(b) 𝐷𝑒𝑏𝑡𝑠𝑆ℎ𝑎𝑟𝑒ℎ𝑜𝑙𝑑𝑒𝑟𝑠 𝐹𝑢𝑛𝑑
(c) Both (a) and (b)
(d) None of these
Answer :
Both (a) and (b)
Q.8 Activity Ratio Also Known As
(a) Performance Ratio
(b) Turnover Ratio
(c) Both (a) and (b)
(d) None of the above
Answer :
Both (a) and (b)
Q.9 Inventory Turnover Ratio=
(a) 𝐶𝑜𝑠𝑡 𝑜𝑓 𝑟𝑒𝑣𝑒𝑛𝑢𝑒 𝑓𝑟𝑜𝑚 𝑜𝑝𝑒𝑟𝑎𝑡𝑖𝑜𝑛 / 𝐴𝑣𝑒𝑟𝑎𝑔𝑒 𝐼𝑛𝑣𝑒𝑛𝑡𝑜𝑟𝑦
(b) 𝐶𝑜𝑠𝑡 𝑜𝑓 𝑟𝑒𝑣𝑒𝑛𝑢𝑒 𝑓𝑟𝑜𝑚 𝑜𝑝𝑒𝑟𝑎𝑡𝑖𝑜𝑛 / 𝑂𝑝𝑒𝑛𝑖𝑛𝑔 𝐼𝑛𝑣𝑒𝑛𝑡𝑜𝑟𝑦
(c) 𝐶𝑜𝑠𝑡 𝑜𝑓 𝑟𝑒𝑣𝑒𝑛𝑢𝑒 𝑓𝑟𝑜𝑚 𝑜𝑝𝑒𝑟𝑎𝑡𝑖𝑜𝑛 / 𝐶𝑙𝑜𝑠𝑖𝑛𝑔 𝐼𝑛𝑣𝑒𝑛𝑡𝑜𝑟𝑦
(d) None of these
Answer :
𝐶𝑜𝑠𝑡 𝑜𝑓 𝑟𝑒𝑣𝑒𝑛𝑢𝑒 𝑓𝑟𝑜𝑚 𝑜𝑝𝑒𝑟𝑎𝑡𝑖𝑜𝑛 / 𝐴𝑣𝑒𝑟𝑎𝑔𝑒 𝐼𝑛𝑣𝑒𝑛𝑡𝑜𝑟𝑦
Q.10 Trade receivable Includes:
(a) Debtors
(b) Bills receivables
(c) both (a) and (b)
(d) Either (a) or (b)
Ans. both (a) and (b)
Answer :
both (a) and (b)
Q.11 Calculate Current Ratio and Liquid Ratio from the given information
Solution: For, 2017-18

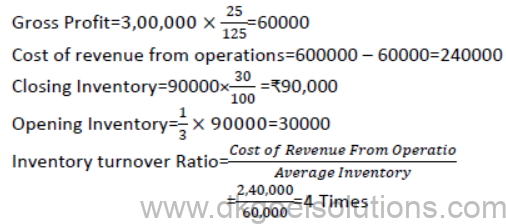
Q.12 From the following information calculate the Inventory Turnover Ratio Revenue from operations ₹6,00,000; Gross profit 25% on cost; Opening inventory was 1/3rd of closing inventory; Closing Inventory was 30% of revenue from operation.
Solution: Revenue from operation=6,00,00
Cost of revenue from operations= Revenue from operation – Gross profit
Q.13 Calculate Net Profit Ratio from the following Statement of profit and Loss
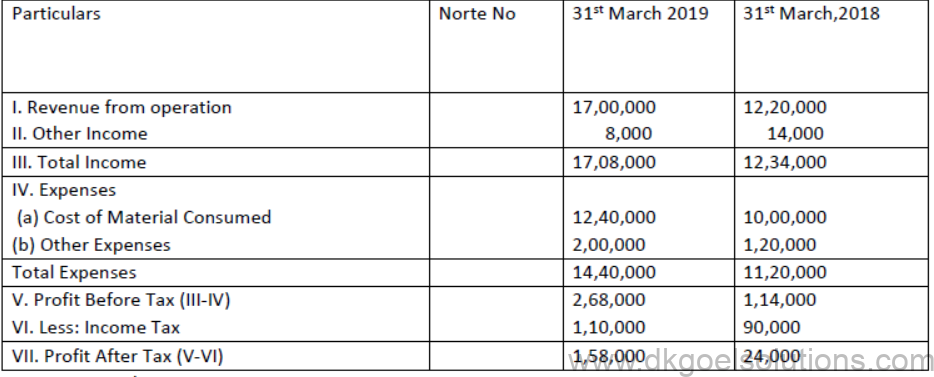
Solution:
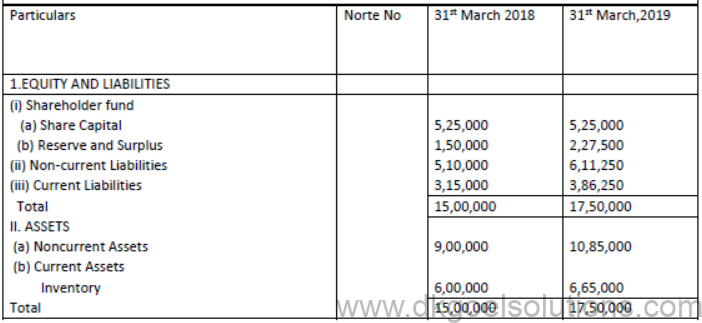
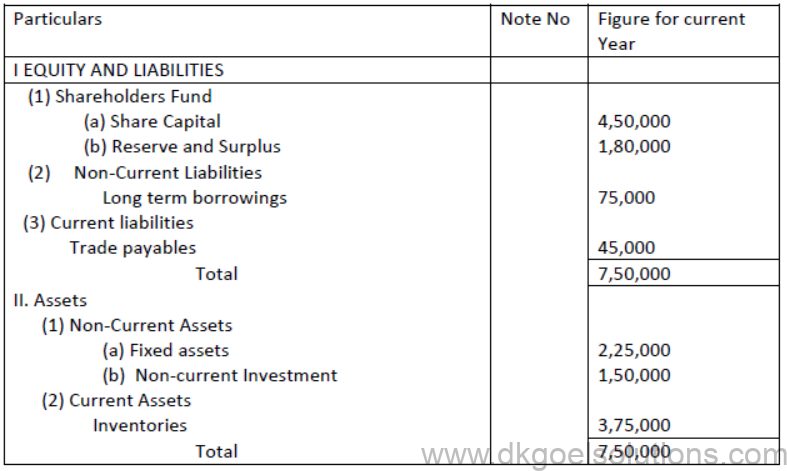
Q.14 Following is the Balance sheet and Statement of profit and loss of a company Statement of Profit and Loss

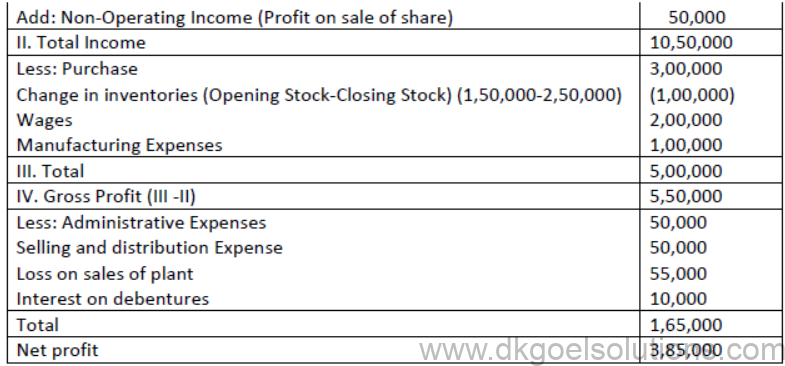
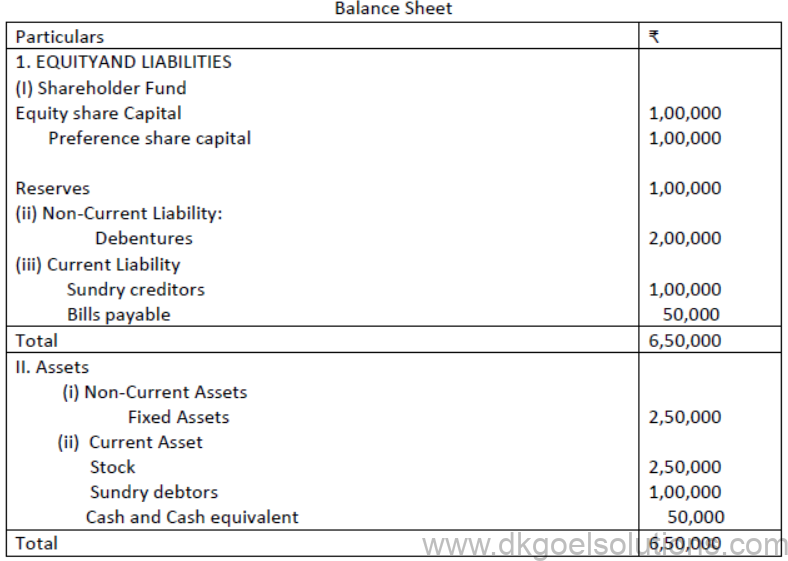
Calculate Following ratios from above information
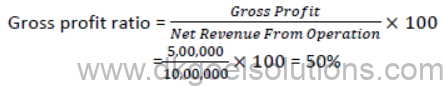
(a) Gross profit ratio
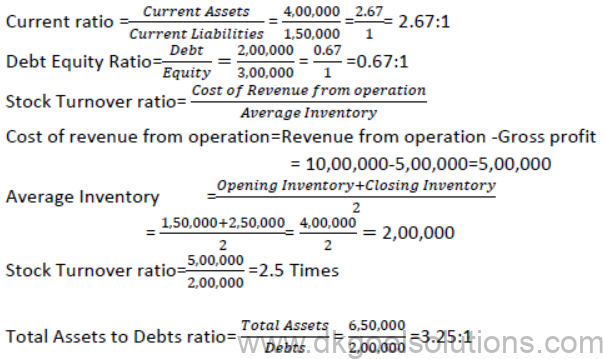
(b) Current Ratio
(c) Debt Equity ratio
(d) Stock Turnover Ratio
(e) Total Assets to Debts Ratio
Solution:
Q.15 Stock at beginning of the year ₹60,000
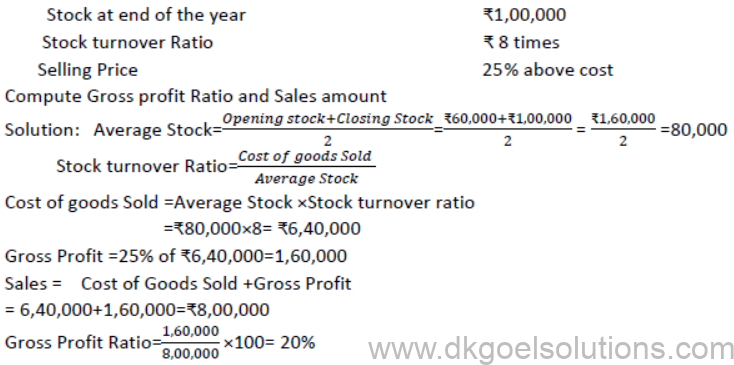
Q.16Calculate ‘Debt-Equity Ratio’ from the following information: Total Assets: Rs. 3,50,000; Total Debt: Rs. 2,50,000; Current Liabilities: Rs. 80,000
Solution: Debt Equity Ratio =𝐷𝑒𝑏𝑡 / 𝐸𝑞𝑢𝑖𝑡𝑦
Debt = Total Debt – Current Liabilities
= Rs. 2,500,000-Rs. 80,000 = Rs. 1,70,000
Equity = Total Assets – Total Debts
= Rs. 3,50,000 – Rs. 2,50,000 = Rs. 1,00,000
Debt – Equity Ratio = 1,70,000 / 1,00,000= 1.7:1
Q.17 From the following information Calculate proprietary Ratio and Total Assets to Debt Ratio Balance sheet of ABC Ltd.
Solution:

Q.18 Calculate Interest Coverage Ratio from the following information.
Net Profit (after taxes) = Rs. 1,00,000
Fixed interest charges on long term borrowing = Rs. 20,000
Rate of Income Tax 50%
Solution: Interest coverage Ratio=𝑃𝑟𝑜𝑓𝑖𝑡 𝑏𝑒𝑓𝑜𝑟𝑒 𝐼𝑛𝑡𝑒𝑟𝑒𝑠𝑡 𝑎𝑛𝑑 𝑇𝑎𝑥 / 𝐼𝑛𝑡𝑒𝑟𝑒𝑠𝑡
Profit before interest and tax =Net profit after Tax+ Income Tax + Interest
=1,00,000+1,00,000+20,000=2,20,000
Interest coverage ratio=2,20,000 / 20,000 =11 Times
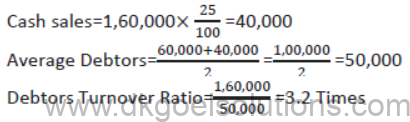
Q.19 Calculate Debtors Turnover Ratio if Closing Debtors are Rs. 40,000; Opening Debtors Rs. 60,000; Cash Sales is 25% of Credit Sales and Total Sales are Rs. 2,00,000.
Solution: Debtors Turnover Ratio = 𝑁𝑒𝑡 𝑐𝑟𝑒𝑑𝑖𝑡 𝑆𝑎𝑙𝑒𝑠 /𝐴𝑣𝑒𝑟𝑎𝑔𝑒 𝑡𝑟𝑎𝑑𝑒 𝑑𝑒𝑏𝑡𝑜𝑟𝑠
Cash Sales = 25% of Credit Sales
Let the Credit Sales be Rs. X
Then Cash Sales is 25% of X
Total Sales = Cash Sales + Credit Sales=Rs. 2,00,000
X+25x/100=2,00,00
100x+25x=2,00,000×100
125x= 2,00,00,000
X=2,00,00,000/125=1,60,000
X = Credit Sales=1,60,000
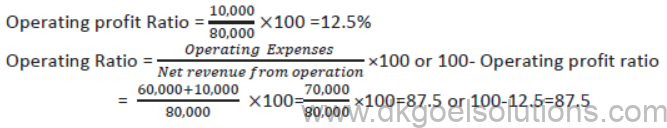
Q.20 Calculate ‘Operating Profit Ration’ and ‘Operating Ratio’ from the following
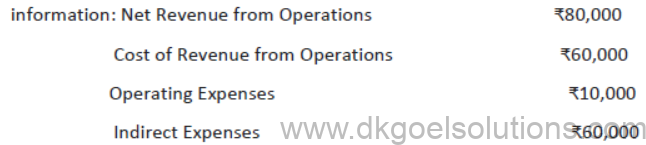
Solution:

Operating profit = Net Revenue from Operation – Operating Cost Operating Cost = Cost of Revenue from Operation + Operating Expenses
= Rs. 60,000+10,000 = Rs. 70,000
Operating profit =80,000 -70,000 = Rs. 10,000
Notes for Accounting Ratios Class 12 Accountancy
Accounting Ratio : It is an arithmetical relationship between two accounting variables.
Ratio Analysis : It is a technique of analysis of financial statements to conduct a quantitative analysis of information in a company’s financial statements.
“Ratio analysis is a study of relationship among various financial factors in a business.”
– Myers
Expression of ration: Ratios are expressed in following four ways:
• Pure Ratio Like 2:1. All liquidity and solvency ratios are expressed in pure form.
• Percentage e.g. 15%. All profitability ratios are presented in percentage form.
• Times Like 4 times. All turnover ratios and Interest Coverage Ratio are presented in this form.
• Fraction like 3/4.
Classification or Types of Ratios:
Ratios can be classified into following 4 categories:
1. Liquidity Rations
2. Solvency Rations
3. Activity Rations also known as turnover Ratios or Performance Ratios.
4. Profitability Rations
IMPORTANT POINT
Note: For Calculation of ratios Formula must be written as it carries marks.
Liquidity Ratios: These measure short term solvency, i.e. the firm’s ability to pay its current dues. In Liquidity Rations the following two ratios are included.
1. Current Ratio also called Working Capital Ratio.
2. Liquid Ratio also called Quick Ratio or Acid Test Ratio.
1. Current Ratio : It shows the relationship of current assets with current liabilities
Current Ratio = Current Assets
An asset shall be classified as current when it satisfies any of the following criteria:
(a) it is expected to be realized in, or is intended for sale or consumption in, the company’s normal operating cycle:
(b) it is held primarily for the purpose of being traded:
(c) it is expected to be realized within twelve months after the reporting date; or
(d) it is cash or cash equivalent unless it is restricted from being exchanged or used to settle a liability for at least twelve months after the reporting date.
The following items are include under Current Assets:
(a) Current investments
(b) Inventories
(c) Trade receivables (Debtors and Bills Receivables) after deducting any provision for Doubtful Debts)
(d) Cash and cash equivalents
(e) Short term loans and advances
(f) Other current assets (Restricted to prepaid expenses, accrued incomes and advance tax only)
Current Liabilities
A liability shall be classified as current when it satisfies any of the following criteria:
(a) It is expected to be settled in the company’s normal operating cycle;
(b) It is held primarily for the purpose of being traded:
(c) It is due to be settled within twelve months after the reporting date; or
(d) The company does not have an unconditional right to defer settlement of the liability for at least twelve months after the reporting date. Terms of a liability that could, at the option of the counter party’ result in its settlement by issue of equity instruments do not affect its classification.
The following items are include under Current Liabilities :
• Short term borrowings
• Trade payables (Creditors and Bills Payable)
• Other current liabilities
• Short terms provisions
1. Significance : It assesses the ability of a business to pay its short term liability on time.
2. Ideal Ratio : 2:1 is considered as best.
• A Low ratio indicates that the company cannot meet its short term liability on time.
• A High ratio indicates that funds have not been used efficiently and lying idle.
2. Quick Ratio : It shows the relationship of quick assets with current liabilities. Current Ratio =
Quick Assets = Current Assets – Inventory – Prepaid Expenses – Advance Tax – Accrued Income
Quick Assets = Current Assets – Other Current Assets
1. Significance : It assesses the ability of a business to pay its short term liability promptly.
2. Ideal Ratio : 1:1 is considered as best.
3. It is better indicator of liquidity as some current assets are not easily convertible into cash.
Solvency Ratio : Solvency ratios convey an enterprise’s ability to meet its long term obligations as and when they becomes due.
1. Debt Equity Ratio
2. Total Assets to Debt Ratio
3. Proprietary Ratio
4. Interest Coverage Ratio
1. Debt Equity Ratio: It show relationship between Debts (Long term Liabilities or Non Current Liabilities) and Equity (Shareholders’ Funds).
Debt Equity Ratio =Debt Long term Liabilities / quity Shareholders’ Funds
Debts = Long-term borrowing + Long-term provisions
Equity/Shareholders’ Funds = Share Capital + Reserves and Surplus – Non – Trading Investments
OR
Equity/Shareholders’ Funds = Fixed Assets (Tangible and Intangible) + Non Current Investment (Excluding Non Trading investment) +Long Terms Loans and Advances + Current Assets – Current Liabilities – Long –term borrowings – Long – term Provision
1. Significance: It assesses the long term soundness of financial position of a business.
2. Ideal Ratio: 2:1 is considered as best but it should not be more than this.
2. Total Assets to Debt Ratio : It shows the relationship between Total Assets and Debts.
Total Assets To Debt Ratio = Total Assets / Debt’s or Long Liabilities
Total Assets = Fixed Assets (Tangible and Intangible) + Non Current Investment (Excluding Non Trading Investment) + Long Term Loans and Advances + Current Assets
Debts = Long-term borrowing + Long-term provisions
Significance: It measures the safety margin available to the providers of long term loans. Ideal Ratio: No ideal ratio but a high ratio indicates higher safety to lenders and low ratio represents risky position.
3. Proprietary Ratio: It shows the relationship between Proprietors’ Funds/shareholders’ Funds and Total Assets of the business.
Proprietary Ratio = Equity shareholders’ Funds / Total Assets
Proprietors’ Funds = Share Capital + Reserves and Surplus-Non Trading Investment
OR
Equity/Proprietors’ Funds = Fixed Assets (Tangible and intangible) + Non Current investments (Excluding Non Trading investment) + Long Terms Loans and Advances + Current Assets – Current Liabilities – Long – term borrowings – Long term provisions.
Total Assets = Fixed Assets (Tangible and Intangible) + Non Current Investment (Excluding Non trading Investment) +long Term Loans and Advances + Current Assets
1. Significance: It measures the proportion of total assets financed by the Proprietors of the business. It shows the safety margin available to the lenders of the business as they can ascertain the portion of the shareholders in the business.
2. Ideal Ratio: No ideal ratio but a high ratio indicates higher safety to lenders and law ratio represents risky position from lender’s point of view.
4.Interest Coverage Ratio : This ratio establishes relationship between the Net Profit before Interest & Tax and interest payable on long term debts (Fixed Interest Charges)
Interest Coverage Ratio =Net Profite fore Interest & Tax / Fixed Interest Charges
1. Since interest is a charge on profit, net profit taken to calculate this ratio is before interest & tax.
2. Objective & Significance-Objective is to ascertain the amount of profit available to cover the interest charge. It determines ease with which a company can pay interest expense on outstanding debt.
. Parties interested in this ratio are debenture holders and lenders of long term credit.
4. High Ratio is better for lenders as it indicates higher safety margin. Activity Ratios/Turnover Ration/Performance Ratios. These ratios measure the efficiency of asset management and measure the effectiveness with which an enterprise uses resources at its disposal. These show rotation of concerned item within an accounting period. Important Turnover ratios are :
1. Stock Turnover Ratio/Inventory Turnover Ratio
2. Debtor Turnover Ratio/Trade Receivables Turnover Ratio
3. Creditors Turnover Ratio/Trade Payables Turnover Ratio
4. Working Capital Turnover Ratio
1. Inventory Turnover Ratio : It is also called as Stock turnover ratio. This ratio is a relationship between the Cost of goods sold e, Cost of Revenue form Operations during a particular period of time and the Cost of average inventory during a particular period.
It is expressed in number of times.
Interest/Stock turnover Ratio = Cost of goods sold Revenue form Operations / average inventory
1. Cost of Goods Sold = Opening Stock + Net Purchases + Direct Expenses – Closing Stock
OR
= Sales/Revenue from Operations – Gross Profit
2. Cost of Revenue from Operations = Cost of Material Consumed + Net Purchases of Stock in Trade + Changes in inventories of Finished Goods, Work in Progress and Stock-in-Trade + Direct Expenses
3. Cost of Material Consumed = Raw Material Purchased + Changes in inventory of Raw Material
4. Changes in inventory = Opening Inventory – Closing Inventory
5.average inventory / Stock = openig inventory + close inventory / 2
This ratio indicates whether investment in stock is within proper limit or not.
This shows how quickly inventory is sold. Generally higher ratio is considered better but very high ratio shows over trading and low ratio means stock is piled up or over investment in stock.
2. Debtors Turnover Ratio/Trade Receivables Turnover Ratio:
It shows the relationship between Net Credit Sales i.e., Net Credit Revenues from Operations and Average Debtors/Average Trade Receivables (Debtors + Bills Receivables).
This ratio is expressed in TIMES.
Trade Receivable/Debtors turnover Ratio ={Net Credit States / Cost of Revenue form Operations} / Average Debtors/Average Trade Receivables
1. Net Credit Sales = Total Sales – Sales Return e., Returns inwards – Cash Sales
2. Average Trade Receivable = {Opening Trade Receivable / Closing Trade Receivable } / 2
3. Receivable are taken before deducting any Provision for Doubtful Debts.
4. If details regarding cash and credit sales are not given then all the sales are taken on credit basis.
5. If details regarding opening and closing values of trade receivable are not given then closing trade receivables are used for calculation of this ratio.
This ratio indicated the number of times the trade receivables are turned in relation to credit sales over a year.
This shows how quickly cash is realized from trade receivables. Generally higher is the ratio, the more efficient is the management of the trade receivables.
3. Creditors Turnover Ratio/Trade Payable Turnover Ratio:
It shown the relationship between Net Credit Purchases and Average Creditors/Average Trade Payables (Creditors + Bills Payable).
This ratio is expressed in TIMES.
Trade Payable/Creditors turnover Ratio = Net Credit Purchases / {Average Creditors/Average Trade Payables}
1. Net Credit Purchases = Total Purchases – Purchases Return/Returns Outwards Cash Purchases
2. Average Trade Receivable ={Opening Trade Receivable / Closing Trade Receivable } / 2
3. If details regarding cash and credit purchases are not given then all the purchases are taken on credit basis.
4. If details regarding opening and closing values of trade payables are not given then closing trade payables are used for calculation of this ratio.
This ratio indicated the number of times the Trade Payables are turned over in relation to credit purchases over a year.
This shows how quickly cash is paid to Trade Payables. Generally lower ratio indicates that more credits are available for a longer period.
4. Working Capital Turnover Ratio : It establishes the relationship between Net Working Capital and Revenue from Operations i.e., Net Sales.
Working Capital Turnover Ratio = {Revenues from Operations / Net Scale} / Net Working Capital
1. Net Working Capital = Current Assets excluding Fictitious assets – Current liabilities.
2. This ratio can also be calculated on the basis of the Cost of Revenue from Operations i.e., Cost of Goods Sold.
3. This Ratio is calculated in Times.
This ratio indicated the number of times the working capital has been turned over in relation to revenue form operations over a year.
Generally a higher ratio indicates efficient use of working capital. Profitability Ratio:
These ratios are used to assess the profitability or earning capacity of the business.
These ratios are very important as profitability is the measurement of the overall performance and efficiency of the management.
The important Profitability ratios are:
1. Gross Profit Ratio
2. Operating Ratio
3. Operating Profit Ratio
4. Net Profit Ratio
5. Return on Investment or Return on Capital Employed. All Profitability ratios are shown in percentage form.
1. Gross Profit Ratio : It shows the relationship between Gross Profits and Net Sales e., Net
Revenue from Operation. Gross Profit Ratio = Gross Profits / {Gross Profits / Net Revenue from Operation.} x 100 –%
This Ratio indicates the margin of gross profits available on Revenue from Operations. Generally a higher ratio indicates better profitability.
2.Operating Ratio: It shows the relationship between Operating Cost and Net Sales i.e., Net Revenue from Operations.
Operating Ratio = Gross Profits / {Gross Profits / Net Revenue from Operation.} x 100 –%
Operating Cost = Cost of Revenue from Operations + Operating Expenses
Operating Expenses = Office and Administration Expenses +Selling and Distribution
OR
Expenses + Depreciation+ Bad debts + Discount on Debtors + Interest on Short term loans.
Operating Cost = Cost of Material Consumed +Net Purchases of Stock in Trade + Changes in Inventories of Finished Goods, Work in Progress and Stock-in-Trade + Direct Expenses = Employees Benefit Expenses + Other Expenses such as Office Administration Expenses + Selling and Distribution Expenses + Depreciation + Bad debts + Discount on Debtors + Interest on short term loans.
This ratio indicates the percentage of Operating costs to Revenue form Operations
Generally a lower Ratio indicates better cost management and profitability.
3. Operating Profit Ratio : It shows the relationship between Operating Profit and Net Sales e., Net Revenue form Operations.
Operating profit Ratio = Gross Profits / {Gross Profits / Net Revenue from Operation.} x 100 –%
Operating Profit = Net Revenue from Operations – Operating Cost
OR
Operating Profit = Gross Profit – Operating Expenses
OR
Operating Profit = Net Profit + Non Operating Expenses – Non Operating Income
Important Points
1. This ratio indicates the margin of operating profits available on Revenue form Operations to cover non operating expenses such as indirect Expenses and Financial Expenses.
2. Generally a higher ratio indicates better profitability.
3. Operating Ratio + Operating Profit Ratio =1
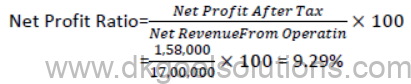
4. Net Profit Ratio : It shows the relationship between Net Profits and Net Sales i.e., Net Revenue from Operations.
Net profit Ratio = Gross Profits / {Gross Profits / Net Revenue from Operation.} x 100 –%
Net Profit = Net Revenue from Operations – Operating Cost – Non Operating expenses + Non Operating Income
OR
Net Profit = Gross Profit – Operating Expenses – Non Operating Expenses + Non Operating Income
OR
Net Profit = Operating Profit – Non Operating Expenses + Non Operating Income Important Points
1. This ratio indicates the percentage of net profits in relation to Revenue from Operations.
2. Generally a higher ratio indicate better profitability.
5. Return on Investment or Return on Capital Employed:
It shows the relationship between Net profit before interest, Tax and Divided and Capital Employed of the business.
Retrun on Investment (ROI) = Gross Profits / {Gross Profits / Net Revenue from Operation.} x 100 –%
By Liability Approach:
Capital Employed = Share Capital + Reserves and Surplus – Non Trading Investments + Non Current Liabilities
OR
Capital Employed = Shareholders’ Funds + Non Current Liabilities By Assets Approach Capital Employed = fixed Assets (Tangible and Intangible) + Non Current Investment
(Excluding Non Trading Investment) + Long Term Loans and Advances + Current Assets – Current Liabilities.
OR
Capital Employed = Fixed Assets (Tangible and Intangible) + Non Current Investment (Excluding Non Trading Investment) + Long Term Loans and Advances + Working Capital
OR
Capital Employed = Non Current Assets + Working Capital
Capital Employed = Total Assets – Current Liabilities.
Important Points
1. This Ratio indicates the percentage of Net profits before interest, tax and dividend in relation to Capital Employed of the business.
2. This Ratio is Considered as best measurement of the overall performance of the enterprise.
3. Generally a higher ratio indicates better profitability.
4. As we are not including Non Trading Investments as part of Capital Employed therefore Income from Non Trading Investments will not be taken into account for calculation of Net Profits.
5. If profits after tax are given in the question then we will find profits before tax with the help of the following formula:
Profits before Tax = {tex}\frac{{\Pr ofits\,after\,Tax}}{{(100 – Tax\,Rates}} \times 100\{/tex}
Also download : Question Papers for Class 12 Accountancy
Andalso refer to DK Goel Solutions for the following chapters
Chapter 1: Financial Statements of a Company (As Per Schedule III)
Chapter 2: Financial Statement Analysis
Chapter 3: Tools for Financial Analysis: Comparative Statements
Chapter 4: Common Size Statements
Chapter 5: Accounting Ratios
Chapter 6: Cash Flow Statement