MCQs for Mathematics Class 9 with Answers Chapter 14 Statistics
Students of Class 9 Mathematics should refer to MCQ Questions Class 9 Mathematics Statistics with answers provided here which is an important chapter in Class 9 Mathematics NCERT textbook. These MCQ for Class 9 Mathematics with Answers have been prepared based on the latest CBSE and NCERT syllabus and examination guidelines for Class 9 Mathematics. The following MCQs can help you to practice and get better marks in the upcoming Class 9 Mathematics examination
Chapter 14 Statistics MCQ with Answers Class 9 Mathematics
MCQ Questions Class 9 Mathematics Statistics provided below have been prepared by expert teachers of grade 9. These objective questions with solutions are expected to come in the upcoming Standard 9 examinations. Learn the below provided MCQ questions to get better marks in examinations.
Question. Sheila received x marks in two of her tests and y marks in three other tests. Her average score in all the five tests in terms of x and y is
(a) 3x+2y/5
(b) 2x+3y/5
(c) 3x+2y/5
(d) 2x+3y/5
Answer
B
Question. For a given data, the difference between the maximum and minimum observations is known as its
(a) class
(b) range
(c) class mark
(d) class limit
Answer
B
Question. Vihaan has marks of 92, 85 and 78 in three mathematics tests. In order to have an average of exactly 87 for the four math tests, he should obtain
(a) 90 marks
(b) 92 marks
(c) 93 marks
(d) 91 marks
Answer
C
Question. A data is such that its maximum value is 75 and range is 20, then the minimum value is
(a) 95
(b) 55
(c) 20
(d) 75
Answer
B
Question. The mean of 30 observations is 12. If 25 is subtracted from the sum of observations, then remaining sum is
(a) 375
(b) 335
(c) 385
(d) 365
Answer
B
Question. In a grouped frequency distribution, the class intervals are 1 – 20, 21 – 40,41 – 60, …, then the class width is
(a) 10.5
(b) 30
(c) 10
(d) 20
Answer
D
Question. Class size of a distribution having 28, 34, 40, 46 and 52 as its class marks is
(a) 3
(b) 4
(c) 5
(d) 6
Answer
D
Question.
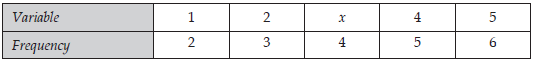
The mean of the above frequency distribution is 3.5, then the value of x is
(a) 4
(b) 3
(c) 2
(d) 5
Answer
B
Question. The class mark of the class interval 2.4–6.6 is
(a) 2.4
(b) 4.5
(c) 6.6
(d) 4.2
Answer
B
Question. The class marks of a frequency distribution are as given below:
38, 43, 48, 53, 58
The class corresponding to the class mark 43 is
(a) 38 – 48
(b) 38.5 – 48.5
(c) 35.5 – 45.5
(d) 40.5 – 45.5
Answer
D
Question. Observe the table given below and choose the correct alternative in each case.
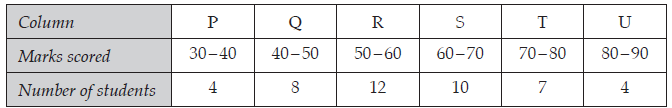
(i) The class mark of R is
(a) 50
(b) 60
(c) 55
(d) 12
Answer
C
(ii) The class width of T is
(a) 70
(b) 10
(c) 80
(d) 7
Answer
B
(iii) The frequency of Q is
(a) 50
(b) 40
(c) 45
(d) 8
Answer
D
(iv) The class size of P is
(a) 80
(b) 10
(c) 90
(d) 4
Answer
B
Question. A grouped frequency table with class intervals of equal sizes using 3–5 (5 included in this interval) as one of the class intervals is constructed for the following data:

The frequency of the class 3– 5 is
(a) 8
(b) 11
(c) 5
(d) 3
Answer
B
Question. Out of sixteen observations arranged in an ascending order, the 8th and 9th observations are 25 and 27. Then, the median is
(a) 25
(b) 27
(c) 26.5
(d) 26
Answer
D
Question. In a grouped frequency distribution, the class intervals are 0 – 10, 10 – 20,20 – 30, …, then the class width is
(a) 20
(b) 15
(c) 10
(d) 30
Answer
C
Question. ‘More than’ cumulative frequency table for a given data is as follows:
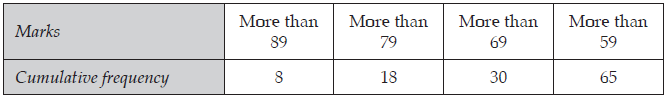
Then, the frequency of the class interval 70 – 80 is
(a) 10
(b) 35
(c) 12
(d) 22
Answer
C
Question. The mean of prime numbers between 30 and 40 is
(a) 37
(b) 31
(c) 34
(d) 36
Answer
C
Question. In a bar graph, 0.25 cm length of a bar represents 100 people. Then, the length of bar which represents 2000 people is
(a) 4 cm
(b) 4.5 cm
(c) 5 cm
(d) 3.5 cm
Answer
C
Question. In a bar graph, the widths of bars
(a) have no significance
(b) are proportional to the corresponding heights
(c) are proportional to the corresponding frequencies
(d) are proportional to the space between two consecutive bars
Answer
A
Question. A student collects information about the number of school going children in a locality consisting of a hundred households. The data collected by him is
(a) primary data
(b) secondary data
(c) grouped data
(d) arrayed data
Answer
A
Question. One of the sides of a frequency polygon is
(a) the x-axis
(b) the y-axis
(c) either of the coordinate axes
(d) neither of the coordinate axes
Answer
A
Question. Which of the following is not a measure of central tendency?
(a) Mean
(b) Median
(c) Mode
(d) Standard deviation
Answer
D
Question. The mean for counting numbers through 100 is
(a) 50
(b) 49.5
(c) 50.5
(d) 51
Answer
C
Question. The mean of first four prime numbers is
(a) 4
(b) 4.5
(c) 3.75
(d) 4.25
Answer
D
Question. The smallest of three consecutive even integers is 32. Then, the mean of the three integers is
(a) 34
(b) 36
(c) 33
(d) 35
Answer
A
Question. When the data consists of 3, 4, 5, 4, 3, 4, 5, which statement is true?
(a) mean > median
(b) mean > mode
(c) median < mode
(d) mean = mode
Answer
D
Question. If each observation of the data is increased by 3, then their mean
(a) becomes 3 times the original mean
(b) is decreased by 3
(c) is increased by 3
(d) remains the same
Answer
C
Question. In the graph given alongside, the number of students who scored 60 or more marks is

(a) 19
(b) 20
(c) 22
(d) 21
Answer
D
Question. The mean of x1, x2 is 6 and mean of x1, x2 , x3 is 7. The value of x3 is
(a) 2
(b) 9
(c) 5
(d) 4
Answer
B
Question. The traffic police recorded the speed (in km/h) of 10 motorists as 48, 52, 57, 55, 42, 39, 60, 49, 53 and 47. Later an error in recording instrument was found. If the instrument had recorded the speed 5 km/h less in each case, then the correct average speed of the motorists is
(a) 50.2 km/h
(b) 52.5 km/h
(c) 55.2 km/h
(d) 54.5 km/h
Answer
C
Question. The marks obtained by 10 students in a mathematics test are 75, 90, 70, 50, 70, 50, 75, 90, 70 and 75. Their median mark is
(a) 70
(b) 71.5
(c) 72.5
(d) 75
Answer
C
Question. Which of the following variables are discrete?
1. Size of shoes 2. Number of pages in a book
3. Distance travelled by a train 4. Time
(a) 1 and 4
(b) 1 and 3
(c) 1 and 2
(d) 2 and 4
Answer
C
Question. The following observations have been arranged in an ascending order:
18, 20, 25, 26, 30, x, 37, 38, 39, 48
If the median of the data is 35, then the value of x is
(a) 35
(b) 40
(c) 45
(d) 50
Answer
B
Question. The given cumulative frequency distribution shows the class intervals and their corresponding cumulative frequencies.

Then, the frequency of class interval 20–30 is
(a) 5
(b) 9
(c) 11
(d) 20
Answer
B
Question. Mode of a set of observations is the value which
(a) occurs most frequently
(b) divides the observations into two equal parts
(c) is the mean of the middle two observations
(d) is the sum of the observations
Answer
A
Question. To analyse the election results, the data is collected from newspapers. The data thus collected is known as
(a) primary data
(b) secondary data
(c) raw data
(d) grouped data
Answer
B
Question. The class size of a distribution is 25 and the first class interval is 200–224. Then, the class marks of first two class intervals are
(a) 212, 237
(b) 237, 262
(c) 212, 262
(d) 237, 287
Answer
A
Question. A set of data consists of six numbers: 7, 8, 8, 9, 9 and x
The difference between the modes when x = 9 and x = 8 is
(a) 4
(b) 1
(c) 2
(d) 3
Answer
B
Question. Given the class intervals 0 – 10, 10 – 20, 20 – 30, …, then 10 is considered in class
(a) 0 – 10
(b) 10 – 20
(c) 0 – 20
(d) 10 – 30
Answer
B
Question. Median of the following observations, arranged in an ascending order is 22.
8, 11, 13, 15, x + 1, x + 3, 30, 35, 40, 43
Then, the value of x is
(a) 16
(b) 18
(c) 19
(d) 20
Answer
D
Question. For which set of data does the median equal the mode?
(a) 3, 3, 4, 5
(b) 3, 3, 4, 5, 6
(c) 3, 3, 4
(d) 3, 4, 5, 6, 6
Answer
C
Question. A grouped frequency distribution table with classes of equal sizes using 105 –120 (120 not included) as one of the class interval is constructed for the following data:

The number of classes in the distribution will be
(a) 7
(b) 6
(c) 5
(d) 4
Answer
B
Question. The mode of 4, 6, 7, 6, 4, 2, 4, 8, 6, 4, 3, 4, 6 is
(a) 6
(b) 4
(c) 3
(d) 2
Answer
B
Question. The graph given alongside shows the frequency distribution of the age of 22 teachers in a school. The number of teachers whose age is less than 40 years is
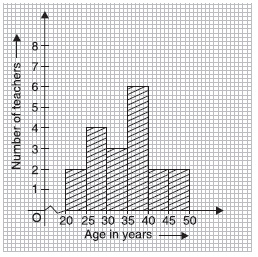
(a) 15
(b) 14
(c) 16
(d) 17
Answer
A
Question.

For the frequency distribution given above, the adjusted frequency for the class 25 – 45 is:
(a) 6
(b) 5
(c) 3
(d) 2
Answer
D
Question. The average of three consecutive even integers is 20. Then, the integers are
(a) 14, 16, 18
(b) 20, 22, 24
(c) 16, 18, 20
(d) 18, 20, 22
Answer
D
Question. ‘Less than’ cumulative frequency table for a given data is as follows:

Then, the frequency of class interval 20–30 is
(a) 20
(b) 14
(c) 55
(d) 34
Answer
A
Question. If the mean of x and 1/x is M, then the mean of x2 and 1/x2 is
(a) 2M2 + 1
(b) 2M + 1
(c) 2M – 1
(d) 2M2 – 1
Answer
D
Question. The mean of six numbers is 23. If one of the numbers is excluded, the mean of the remaining numbers becomes 20. The excluded number is
(a) 36
(b) 38
(c) 39
(d) 37
Answer
B
Question. The mean of five observations is 15. If the mean of first three observations is 14 and that of last three is 17, then the third observation is
(a) 29
(b) 18
(c) 31
(d) 32
Answer
B
Question. The mean of n observations is x. If the first item is increased by 1, second by 2, third by 3 and so on, then the new mean is


Answer
A
Question. The given data is 3, 5, 6, 7, 5, 4, 7, 5, 6, x, 8 and 7. Then, the value of x for which the mode of the above data will be 7, is
(a) 5
(b) 6
(c) 8
(d) 7
Answer
D
Question. If the mean of the observations:
x, x + 3, x + 5, x + 7, x + 10 is 9, the mean of last three observations is
(a) 11.2/3
(b) 11.1/3
(c) 10.1/3
(d) 10.2/3
Answer
B
Question. For a frequency distribution, mean, median and mode are connected by the relation:
(a) Mode = 3 Median – 2 Mean
(b) Mode = 3 Median + 2 Mean
(c) Mode = 3 Mean – 2 Median
(d) Mode = 2 Median – 3 Mean
Answer
A
Question. The difference between the mean and median of first five prime numbers is
(a) 1
(b) 0.4
(c) 0.6
(d) 0.8
Answer
C
Question. For drawing a frequency polygon of a continuous frequency distribution, we plot the points whose ordinates are the frequency of respective classes and abscissa are respectively
(a) lower limits of the classes
(b) upper limits of the classes
(c) class marks of the classes
(d) upper limits of preceeding classes
Answer
C

We hope the above multiple choice questions for Class 9 Mathematics for Chapter 14 Statistics provided above with answers based on the latest syllabus and examination guidelines issued by CBSE, NCERT and KVS are really useful for you. Statistics is an important chapter in Class 9 as it provides very strong understanding about this topic. Students should go through the answers provided for the MCQs after they have themselves solved the questions. All MCQs have been provided with four options for the students to solve. These questions are really useful for benefit of Class 9 students. Please go through these and let us know if you have any feedback in the comments section.