Sample Paper Class 12 Economics Term 2 Set B
Please refer to Sample Paper Class 12 Economics Term 2 Set B with solutions provided below. We have provided CBSE Sample Papers for Class 12 Economics as per the latest paper pattern and examination guidelines for Standard 12 Economics issued by CBSE for the current academic year. The below provided Sample Guess paper will help you to practice and understand what type of questions can be expected in the Class 12 Economics exam.
CBSE Sample Paper Class 12 Economics for Term 2 Set B
1. If the real GDP is ₹ 300 and nominal GDP is ₹ 330, calculate price index (base = 100).
OR
Explain why subsidies are added to and indirect taxes deducted from domestic product at market price to arrive at domestic product at factor cost.
Answer. (i) Real GDP = Price of base year × Quantity of Current Year
300 = 100 × Quantity of Current Year
Quantity of Current Year = 300/100 = 3
(ii) Nominal GDP = Price of Current year × Quantity of Current Year
330 = Price of Current year × 3
Price of Current year = 330/3 = 110
(iii) Price Index = (Price of Current year/Price of Base year) × 100 = (110/100) × 100 = 110
OR
Net Domestic Product at Factor Cost (NDPFC).
NDPFC refers to a total factor income earned by the factors of production within the domestic territory of a country during an accounting year.
NDPFC = NDPMP – Net Indirect Taxes
Where,
(i) Indirect Taxes are the taxes which are levied by the government on production and sale of commodity. Sales tax, excise duty, custom duty, etc are some of the indirect taxes. Due to this market price increases.
(ii) And subsidies are the cash grants given by the government to the enterprises to encourage production of certain commodities, to promote exports or to sell goods at prices lower than the free market price. In India, LPG cylinder is sold at subsidized rates. Due to this market price decreases.
FC = MP – NIT (Indirect Taxes – Subsidies)
2. In an economy, total savings are ₹ 2,000 crores and the ratio of average propensity to save and average propensity to consume is 2 : 7. Calculate the level of income in the economy.
OR
An economy is in equilibrium. Calculate Marginal Propensity to Consume:
National Income = 1,000
Autonomous Consumption Expenditure = 200
Investment expenditure = 100
Answer. APS : APC = 2 : 7 [Given]
C = C¯ + bY = 200 + 1,000b
I = 100
AD = C + I = 200 + 1,000b + 100
= 300 + 1,000b
At equilibrium, Y = AD
1,000 = 300 + 1,000b; b = 0.7
3. Explain the meaning of average propensity to consume. What is its relation with average propensity to save?
Answer. The ratio of aggregate consumption expenditure to aggregate income is known as average propensity to consume. It indicates the percentage (or ratio) of income which is being spent on consumption. It is worked out by dividing total consumption expenditure (C) by total income (Y).

4. How does economic growth contribute to the growth of infrastructure sector?
OR
What is the situation of women’s health in India?
Answer. Growth leads to increase in demand for infrastructure and whenever there is increase in demand of something. There is also increase in its supply, if there is unused potential. It is shown with the help of a diagram.

OR
(i) Women have several disadvantages in the areas of health as compared to men.
(ii) Sex ratio is continuously declining and is an indicator of female foticide.
(iii) Close to 3, 00,000 girls under the age of 15 are married and have one child.
(iv) More than half of Indian women are anemic in the age group of 15-49.
5. Differentiate between biotic and abiotic elements of environment.
Answer.

6. Give the meaning of factor income to abroad and factor income from abroad. Also give an example of each.
OR
Sale of petrol and diesel cars is rising particularly in big cities. Analyse its impact on gross domestic product and welfare.
Answer. (i) The difference between national income and domestic income is Net Factor Income from abroad (NFIA), which is included in National Income and excluded from Domestic Income.
(ii) Where NFIA is the difference between income earned by normal residents from rest of the world (factor income from abroad) and similar payments made to Non residents within the domestic territory (factor income to abroad).
(iii) For example, let Income earned by normal residents from rest of the world (factor income from abroad) is ₹ 10000 crore and payments made to Non residents within the domestic territory(factor income to abroad) is ₹ 8000 crore.
Then NFIA Will be factor income from abroad minus factor income to abroad
= ₹ 10,000 cr – ₹ 8,000 cr = ₹ 2,000 cr.
OR
(i) Increase in the sale of petrol and diesel cars raises the standard of living and consequently welfare. But it may not necessarily always be so.
(ii) For example, manufacturing of such cars can raise output but at the same time lead to water and air pollution also, that reduces welfare of the people.
(iii) Such a reduction in welfare may outweigh the increase in welfare and thus leads to overall reduction in welfare.
7. What will happen if there is no additional employment generated in the economy even though economy is able to produce goods and services in the economy? How will jobless growth happen?
Answer. A jobless growth happens when production takes place using capital intensive methods. Such a jobless growth is dangerous for the economy.
(i) Unless employment is generated in the economy, poverty can’t be eradicated.
(ii) Without employment, people will not have an income. Without an income, who will buy the goods and services? It will lead to depression in the economy. Read the following text carefully and answer question number 8 and 9 given below: India and China command special attention, not just in Asia (for example, in the Asia-Pacific Economic Cooperation [APEC] forum and the Council for Security Cooperation in the Asia Pacific [CSCAP]) but also in the global economy and in the biennial, multi-country consultative summit meeting known as the G-20, which is acquiring growing importance in the international arena. China and India are the world’s two most populous countries. They have sustained the world’s highest annual gross domestic product (GDP) growth rates over the past decade—9 percent for China and 6 or 7 percent for India. The two countries have been among the world’s most successful in weathering the challenges of the global economy’s Great Recession since 2008. China has accomplished this through a combination of a large government stimulus program (as a share of its GDP twice as large as that of the United States) and an effective infrastructure-building program. India’s similarly successful efforts in sustaining rapid growth despite the global recession have been due to its lesser dependence on exports to drive its economy and an expansion of domestic demand. The two countries arguably have the greatest influence and leverage among the ten emerging-market countries in the G-20. Their joint influence has been decisive in aborting the World Trade Organization’s Doha Development Round of negotiations on trade liberalization, as well in the failure—whether for good or ill—of the 2009 UN Climate Change Conference (also known as the Copenhagen Summit). China has become the world’s largest source of net capital outflows (Wolf et al., forthcoming). India’s popularity as a destination for foreign capital inflows is rapidly increasing, and India is the world’s largest recipient of foreign outsourcing of computer-based services.1 China and India are both heavily dependent on imported oil: They are the world’s second- and fourthlargest importers, respectively. Shifting to a very different realm, China is the most aggressive opponent of the Dalai Lama and Tibetan autonomy, while India is their most vigorous supporter. The prominence of India and China in all of these issues is indisputable. But the relevance of the four domains to each of the above issues varies. The two countries’ demographics have some bearing on most of these issues. China’s and India’s likely economic growth trajectories affect and are affected by most of them. Science and technology in the two countries will affect their respective competitive positions in several of these issues, as will their respective performance in the domain of defense spending and procurement.
8. Mention the strategies followed by India and China which helped them to maintain a high growth rate for a decade?
Answer. India and China have sustained the world’s highest annual gross domestic product (GDP) growth rates over the past decade — 9 percent for China and 6 or 7 percent for India. The two countries have been among the world’s most successful in weathering the challenges of the global economy’s Great Recession since 2008.
China’s policy – China has accomplished this through a combination of a large government stimulus program and an effective infrastructure-building program.
India’s similarly successful efforts in sustaining rapid growth despite the global recession have been due to its lesser dependence on exports to drive its economy and an expansion of domestic demand.
9. Mention some of the domains which are relevant in context of two countries.
Answer. (i) The two countries’ demographics have some bearing on most of economic issues.
(ii) China’s and India’s likely economic growth trajectories affect and are affected by most of them.
(iii) Science and technology in the two countries will affect their respective competitive positions in several of these issues, as will their respective performance in the domain of defence spending and procurement.
10. Distinguish between stocks and flows. Give two examples of each.
Answer.

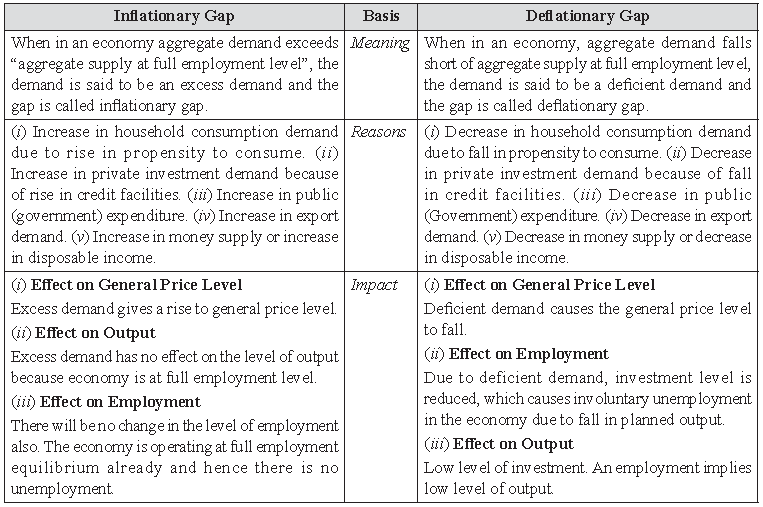
11. Differentiate between inflationary gap and deflationary gap. Show deflationary gap on a diagram. Can this gap exist at equilibrium level? Explain.
Answer.

Yes, deflationary gap can exist at equilibrium level of income. In the below figure equilibrium is attained at a equilibrium point E1, when deflationary gap is EB.

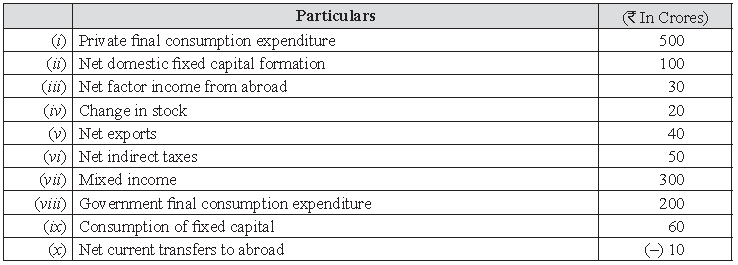
12. (a) Calculate national income from the following

(b) What precautions should be taken while estimating national income by expenditure method?
OR
(a) From the following data calculate Gross domestic product at market price

Answer. (a) GDPMP = Government Final Consumption Expenditure + Private Final Consumption Expenditure + Gross Domestic Capital Formation + Net Export
= (viii) + (i) + (ii) + (ix) + (iv) + (v)
= 200 + 500 + 100 + 60 + 20 + 40 = ₹ 920 crores
NNPFC = GDPMP – Depreciation + Net Factor Income from abroad – NIT
= 920 – (ix) + (iii) – (vi) = 920 – 60 + 30 – 50 = ₹ 840 crores
(b) (i) Avoid Intermediate Expenditure: By definition, the method includes only final expenditures, i.e. expenditure on consumption and investment. Like in the value added method, inclusion of intermediate expenditure like that on raw materials, etc. will mean double counting.
(ii) Do Not Include Expenditure on Second Hand Goods and Financial Assets: Buying secondhand goods is not a fresh production activity. Buying financial assets is not a production activity because financial assets are neither goods nor services. Therefore, they should not be included in estimation of national income.
(iii) Include the Self Use of Own Produced Final Products: For example, a house owner using the house himself. Although explicitly he does not incur any expenditure, implicitly he is making payment of rent to himself. Since the house is producing a service, the imputed value of this service must be included in national income.
(iv) Avoid Transfer Expenditures: A transfer payment is a payment against which no services are rendered.
Therefore no production takes place. Since no production takes place in national income. Charities, donations, gifts, scholarships, etc are some of its examples.
OR
(a) NDPFC = Compensation of Employees + [(Rent + Interest) + profit]
= 3,000 + [(800 + 900) + 1,300] = 2,000 + 3,000 = ₹ 6,000 crore
Gross domestic capital formation = Gross fixed capital formation + Change in stock
Net domestic capital formation + Depreciation = Gross fixed capital formation + Change in stock
800 + Depreciation = 850 + 50
Depreciation = 100
GDPFC = NPFFC + Depreciation = 6,000 + 100 = ₹ 6,100 crore
(b) GVAMP = NVAFC + Depreciation + Net Indirect Tax
= 100 + 10 + (20 – 5) = ₹ 125 lakhs
GVAMP = Value of output – Intermediate Consumption
125 = Value of output – 75
Value of output = 175 – 75 = ₹ 200 lakhs.
13. (a) Health care in India is suffering from urban-rural and rich-poor divide. Explain how?
(b) What is carrying capacity of the environment? How is it related to sustainable development?
Answer. (a) It is rightly said that health care in India suffers from urban-rural and rich-poor divide. 70% population is living in rural areas while 20% of the hospitals are located in rural areas. It means 80% hospitals are serving 30% population. Of 7 lakh beds only 11% are in rural areas. There are only 0.36 hospitals for one lakh people in rural areas whereas it is 3.6 hospital per one lakh population in urban areas, i.e. number of hospitals in urban areas is 10 times the number of hospitals in rural areas. In villages specialised medical care is completely missing like paediatrics, gyecology, anesthesia and obstetrics. PHCs located in rural areas do not have even X-ray or blood test facility. 20% of doctors passing leave the country for better prospects. Many others are interested in urban areas, rare are the ones interested in rural areas. The poorest one fifth spends 12% of their income on health while rich spend only 2% of their income on health.
(b) Carrying capacity of the environment implies that the resources extraction is not above the rate of regeneration of the resources and the wastes generated are within the assimilating capacity of the environment.
It is related to sustainable development because development is sustainable as long as an economy is operating within carrying capacity of the environment. As soon as we cross carrying capacity, we start facing the problem of environment degradation and development is not sustainable anymore. If these two conditions are not fulfilled, then environment fails to perform its vital functions of life sustenance and it leads to the situations of environmental crises.

